

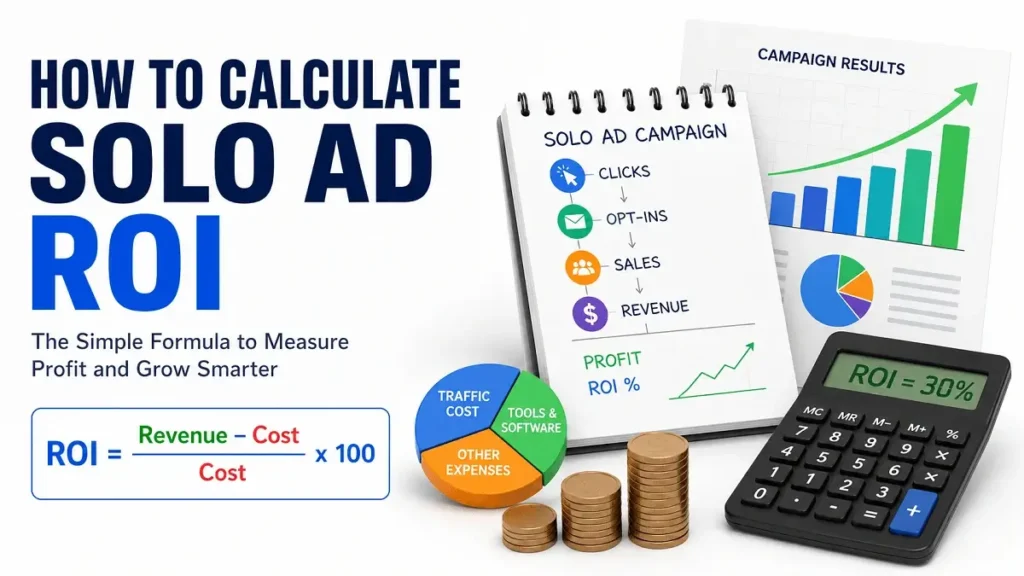
Solo ad ROI tells you whether the money generated by a campaign was greater or smaller than what you spent to run it.
The basic formula is:
ROI = (Revenue − Campaign Cost) ÷ Campaign Cost × 100
If you spend $200 on traffic and generate $260 in revenue:
($260 − $200) ÷ $200 × 100
= 30% ROI
You made $60 more than you spent, giving the campaign a 30% return.
If you spend $200 and generate only $150:
($150 − $200) ÷ $200 × 100
= −25% ROI
The campaign is currently down $50.
The calculation itself is easy.
The harder part is deciding when to calculate it, which costs to include, and how much value to assign to leads that may buy later.
Want to calculate your own numbers? Use the Solo Ad ROI Calculator to quickly check your campaign profit, loss and ROI.
- A Simple Solo Ad ROI Example
- Positive, Negative and Break-Even ROI
- Break-Even Is a Useful Number to Know Before You Buy
- How Many Sales Do You Need to Break Even?
- ROI and ROAS Are Not Exactly the Same Thing
- Which Campaign Cost Should You Use?
- Keep the Formula Consistent When Comparing Providers
- Why Day-One ROI Can Be Misleading
- Use the Same Review Windows for Every Campaign
- Don't Wait Forever for a Bad Campaign to Become Good
- Cost Per Lead and ROI Answer Different Questions
- A Cheap Lead Is Not Automatically a Profitable Lead
- Follow the Entire Funnel
- Revenue Attribution Can Get Complicated
- Tag Subscribers by Campaign
- What If You Earn Affiliate Commissions?
- Refunds Can Change ROI
- Recurring Revenue Changes the Picture Too
- Realized ROI vs Expected ROI
- How Lead Value Connects to ROI
- What Is a Good Solo Ad ROI?
- Don't Expect Every Test to Be Profitable
- Compare Providers Using More Than ROI
- One Campaign Doesn't Establish a Permanent ROI
- Scaling Can Change ROI
- Landing Page Improvements Can Increase ROI Without Cheaper Traffic
- Better Follow-Up Can Do the Same Thing
- Where Did the Campaign Fail?
- A Full Solo Ad Campaign Example
- A Simple ROI Record to Keep
- The Formula Is Simple, but the Timeline Matters
A Simple Solo Ad ROI Example
Imagine you buy:
300 clicks
Campaign cost: $180
Leads: 90
Sales: 6
Revenue: $270
Your profit before other expenses is:
$270 − $180 = $90
Your ROI is:
$90 ÷ $180 × 100 = 50%
So:
Campaign cost: $180
Revenue: $270
Profit: $90
ROI: 50%
That is a profitable campaign based on the numbers we currently have.
But let’s change one thing.
Suppose the same campaign generates only $120 in revenue.
$120 − $180 = −$60
Then:
−$60 ÷ $180 × 100 = −33.3% ROI
Same traffic cost. Very different result.
Positive, Negative and Break-Even ROI
You can think about ROI in three simple states.
Positive ROI
You generated more revenue than the campaign cost.
Example:
Spend: $200
Revenue: $280Profit: $80
ROI: 40%
Break-even
Revenue equals the campaign cost.
Spend: $200
Revenue: $200Profit: $0
ROI: 0%
You recovered the traffic cost but did not make a profit from it yet.
Negative ROI
Revenue is below campaign cost.
Spend: $200
Revenue: $140Loss: $60
ROI: −30%
That does not automatically mean the campaign must be abandoned immediately, especially if you are building an email list.
But it does mean the campaign has not paid for itself yet.
Break-Even Is a Useful Number to Know Before You Buy
Before running a solo ad, I like knowing what has to happen for the campaign to recover its cost.
Suppose:
Campaign cost: $200
Commission per sale: $50
To break even:
$200 ÷ $50 = 4 sales
Four sales recover your $200.
Anything above that starts producing profit before other expenses.
Now imagine the commission is only $20.
$200 ÷ $20 = 10 sales
Same campaign cost, but you need far more conversions.
Knowing this before buying traffic gives you a much clearer target.
How Many Sales Do You Need to Break Even?
The basic formula is:
Break-even sales = Campaign cost ÷ Revenue per sale
For example:
Campaign cost: $300
Revenue per sale: $60
Then:
$300 ÷ $60 = 5 sales
If your funnel typically converts one out of every 30 leads into a sale, you can work backward even further.
To generate five sales:
5 × 30 = approximately 150 leads
If your landing page converts 30% of visitors:
150 ÷ 0.30 = approximately 500 clicks
Now your funnel starts to tell a story:
500 clicks
→ 150 leads
→ 5 sales
→ break-even
These are estimates, not guarantees, but this kind of calculation is much more useful than simply deciding to buy 500 clicks because a provider offers a discount.
You can also use the Solo Ad Break-Even Calculator to see exactly how much revenue your campaign needs before it becomes profitable.
ROI and ROAS Are Not Exactly the Same Thing
These two terms are often mixed together.
ROAS usually compares revenue directly with advertising spend:
ROAS = Revenue ÷ Ad Spend
If you spend $200 and generate $300:
$300 ÷ $200 = 1.5x ROAS
or:
150% ROAS
ROI subtracts the cost first:
($300 − $200) ÷ $200 × 100
= 50% ROI
So the same campaign can be described as:
1.5x ROAS
50% ROI
For our purposes, ROI is useful because it makes the gain or loss easier to see.
Which Campaign Cost Should You Use?
There are two ways I would look at this.
Traffic-only ROI
This compares revenue with the actual solo ad purchase.
Example:
Solo ad cost: $200
Revenue: $280
ROI:
($280 − $200) ÷ $200 × 100
= 40%
That is useful when comparing traffic providers.
Full campaign ROI
You may also have costs such as:
- tracking software
- landing-page software
- email marketing software
- creative work
- transaction fees
- other campaign-specific expenses
Imagine:
Solo ad traffic: $200
Tracking allocation: $15
Landing-page software allocation: $10
Other costs: $5Total cost: $230
If revenue is $280:
($280 − $230) ÷ $230 × 100
= about 21.7% ROI
That is quite different from 40%.
Neither calculation is wrong.
They answer different questions.
For provider comparisons, traffic-only ROI can be useful.
For understanding whether the whole campaign actually made money, I would prefer total campaign cost.
Keep the Formula Consistent When Comparing Providers
Suppose you compare two sellers.
For Provider A you calculate ROI using only traffic cost.
For Provider B you include:
- traffic
- software
- transaction fees
- landing-page costs
The comparison is no longer fair.
Whatever method you choose, apply it consistently.
The same principle came up in our Cost Per Lead guide.
Consistency matters more than making the spreadsheet complicated.
Why Day-One ROI Can Be Misleading
Solo ads are often used to build an email list.
That means a visitor does not necessarily need to buy immediately.
Imagine:
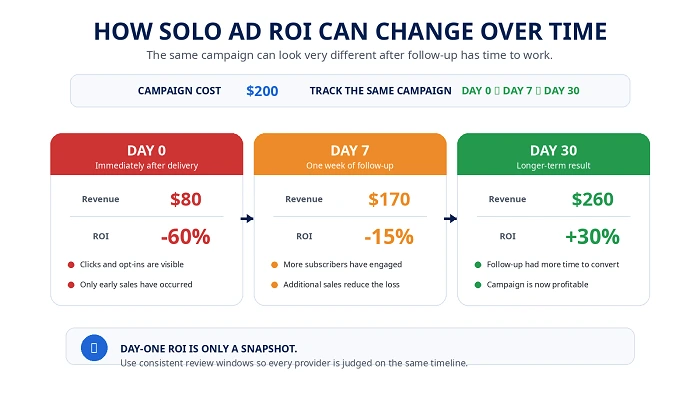
Campaign cost: $200
On Day 0:
Revenue: $80
Your immediate ROI is:
($80 − $200) ÷ $200 × 100
= −60%
That looks terrible.
But after your email follow-up sequence:
Day 7 revenue: $170
Now:
($170 − $200) ÷ $200 × 100
= −15%
After 30 days:
Revenue: $260
Now:
($260 − $200) ÷ $200 × 100
= 30%
Nothing about the original traffic changed.
What changed was how much value those leads produced over time.
This is why I would not necessarily judge a list-building campaign by immediate sales alone.
Use the Same Review Windows for Every Campaign
I like using consistent checkpoints.
For example:
Day 0
Campaign cost
Clicks
Leads
CPL
Immediate revenue
Day 7
Follow-up clicks
Early sales
Cumulative revenue
Current ROI
Day 30
Additional sales
Total revenue
Longer-term engagement
Final or updated ROI
You could use 14, 30 or 60 days depending on your funnel.
The important part is comparing campaigns using similar windows.
Otherwise:
Provider A after 30 days
versus:
Provider B after 2 days
does not tell you very much.
Don’t Wait Forever for a Bad Campaign to Become Good
There is also a danger in longer-term tracking.
It becomes easy to say:
“Maybe they’ll buy next month.”
Then next month:
“Maybe later.”
Eventually, the campaign needs to prove itself.
If subscribers are not:
- opening
- clicking
- buying
- responding
- taking any meaningful action
then the theoretical future value of those leads becomes harder to defend.
Long-term measurement should give the campaign a fair evaluation window.
It should not become an excuse to avoid admitting that the traffic performed poorly.
Cost Per Lead and ROI Answer Different Questions
Suppose two providers produce:
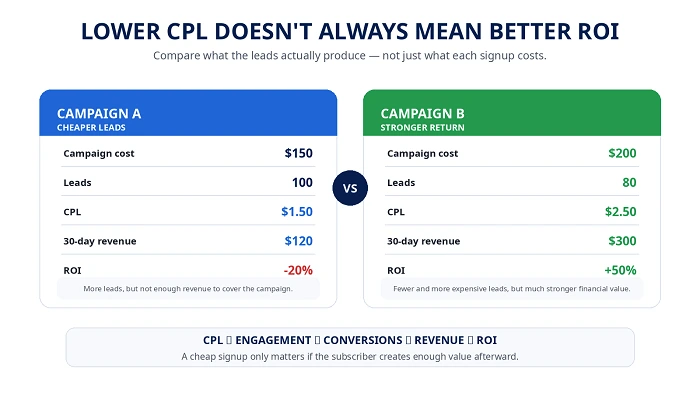
Provider A
Campaign cost: $150
Leads: 100
CPL: $1.50
Provider B
Campaign cost: $200
Leads: 80
CPL: $2.50
If you stop there, Provider A looks much better.
Now suppose after 30 days:
Provider A revenue: $120
ROI:
($120 − $150) ÷ $150 × 100
= −20%
Provider B produces:
Revenue: $300
ROI:
($300 − $200) ÷ $200 × 100
= 50%
Provider B had the more expensive leads.
But those leads created substantially more value.
That is why I would never optimize a campaign around CPL alone.
A Cheap Lead Is Not Automatically a Profitable Lead
This is one of the themes running through all of our guides.
Imagine:
Campaign A
150 leads
CPL: $1.20
Sales: 2
Revenue: $80
and:
Campaign B
90 leads
CPL: $2.40
Sales: 8
Revenue: $320
Campaign A gives you far more subscribers for less money per subscriber.
Campaign B gives you far more revenue.
Which one would you rather scale?
If the goal is ultimately making the funnel financially sustainable, Campaign B deserves much more attention.
Follow the Entire Funnel
Instead of focusing on one isolated metric, I would look at the sequence.
Clicks > Opt-ins > Cost per lead >Follow-up engagement > Conversions > Revenue >ROI
Each metric answers a different question.
CPC: How much did traffic cost?
Opt-in rate: How effectively did the page turn visitors into subscribers?
CPL: How much did each subscriber cost?
Engagement: Did the subscribers remain interested?
Conversions: Did they take the action you wanted?
ROI: Did the value generated justify what you spent?
That is why How to Track Solo Ads comes before calculating ROI.
Without good tracking, the final number is much harder to trust.
Revenue Attribution Can Get Complicated
Suppose someone joins your list from Provider A.
Three weeks later they purchase something.
You want your tracking system to retain enough information to connect that subscriber back to Provider A.
Otherwise you may know:
$500 revenue generated this month
without knowing which traffic source helped produce it.
This becomes particularly important once you are running:
- several providers
- multiple landing pages
- organic traffic
- social traffic
- other paid campaigns
Source tagging makes longer-term ROI analysis much more useful.
Tag Subscribers by Campaign
A simple setup might be:
provider-a-test-1
provider-a-test-2
provider-b-test-1
If your email or tracking platform keeps that information attached to the subscriber, you can later compare:
opt-in rate
CPL
email engagement
conversions
revenue
by source.
That gives you a much stronger provider comparison than simply looking at delivered clicks.
What If You Earn Affiliate Commissions?
If you are sending traffic into an affiliate funnel, use the commission actually attributed to the campaign.
Imagine:
Solo ad cost: $250
Affiliate commissions: $375
Traffic-only ROI:
($375 − $250) ÷ $250 × 100
= 50%
But be careful about confusing:
product sales value
with:
the amount you actually earned.
If a product costs $500 but your commission is $100, your campaign revenue is $100, not $500.
Use money that actually belongs to your business.
Refunds Can Change ROI
Suppose:
Campaign cost: $200
Initial revenue: $300
You calculate:
50% ROI
Then $100 worth of sales is refunded.
Actual revenue becomes:
$200
Your ROI falls to:
0%
So for products with meaningful refund periods, it can be worth waiting until that period passes before treating the ROI as final.
Recurring Revenue Changes the Picture Too
Some offers pay recurring commissions or subscriptions.
Imagine one subscriber generates:
Month 1: $20
Month 2: $20
Month 3: $20
That is:
$60 total revenue
If you look only at Month 1, you may underestimate the value of the campaign.
This is where lead and customer lifetime value becomes useful.
But I would keep two things separate:
Revenue already earned
and
Revenue you expect to earn
Expected future value can help with planning.
It should not be presented as if the money has already arrived.
Realized ROI vs Expected ROI
I like making this distinction.
Realized ROI
Uses actual revenue you have already received.
Example:
Spend: $200
Actual revenue: $240
ROI:
20%
Expected ROI
May include estimated future revenue from current leads or customers.
Suppose historical data suggests those leads may generate another $100.
Expected total:
$340
Estimated ROI:
($340 − $200) ÷ $200 × 100
= 70%
That can be useful for forecasting.
But I would label it clearly as an estimate.
Otherwise you can make almost any campaign look profitable by assigning optimistic future value to the leads.
How Lead Value Connects to ROI
Suppose you have enough history to estimate that the average lead eventually generates:
$3
Now imagine a new campaign produces:
100 leads
Estimated lead value:
100 × $3 = $300
If the campaign cost $180:
estimated value difference = $120
This suggests the economics might be attractive.
But again, this is based on your historical average.
It is not the same thing as already earning $300.
The stronger your historical data becomes, the more useful lead-value forecasting becomes.
What Is a Good Solo Ad ROI?
I would not use one percentage as a universal benchmark.
Obviously:
positive ROI is better than negative ROI
but even that needs context.
A campaign producing 10% ROI consistently and at meaningful scale may be more useful than one small campaign that happened to produce 200%.
You also have to consider:
- volatility
- refund rates
- time until revenue arrives
- operational costs
- whether the campaign can scale
- lead quality
- opportunity cost
I would rather see a repeatable, understandable campaign than one spectacular result I cannot reproduce.
Don’t Expect Every Test to Be Profitable
Testing costs money.
Suppose you try three providers:
Provider A: −35% ROI
Provider B: −10% ROI
Provider C: +45% ROI
The first two campaigns did not make money.
But they gave you information.
If Provider C continues performing well, the losing tests helped you identify the traffic worth buying.
That does not mean losing campaigns are automatically good because they teach you something.
It simply means testing and profitability are not always the same thing.
The purpose of testing is to reduce uncertainty so future decisions become better.
Compare Providers Using More Than ROI
Imagine:
Provider A ROI: 30%
Provider B ROI: 28%
At first glance they are nearly identical.
But maybe:
Provider A produced 50 leads
Provider B produced 150 leads
Or:
Provider A revenue arrived immediately
Provider B revenue took 60 days
Or:
Provider A performed consistently across five tests
Provider B had one excellent campaign and four poor ones
ROI is important.
Context still matters.
One Campaign Doesn’t Establish a Permanent ROI
Suppose your first test generates:
80% ROI
That does not mean every future order from the provider will generate 80%.
Likewise, one campaign at −20% does not necessarily prove that every future test will lose money.
Results move.
That is why I would record each campaign individually.
For example:
| Test | Cost | Revenue | ROI |
|---|---|---|---|
| Test 1 | $150 | $195 | 30% |
| Test 2 | $200 | $250 | 25% |
| Test 3 | $300 | $390 | 30% |
Now you have something interesting.
The results are relatively consistent.
Compare that with:
| Test | Cost | Revenue | ROI |
|---|---|---|---|
| Test 1 | $150 | $375 | 150% |
| Test 2 | $200 | $80 | -60% |
| Test 3 | $300 | $190 | -36.7% |
The first campaign looked amazing.
The overall picture looks much less convincing.
Scaling Can Change ROI
Suppose:
200-click test → 50% ROI
You increase to:
500 clicks → 35% ROI
Then:
1,000 clicks → 12% ROI
The campaign is still profitable, but efficiency is declining.
That can happen if larger orders reach less responsive parts of the audience.
It could also be normal campaign variation.
This is why we discussed gradual scaling in How Many Solo Ad Clicks Should You Buy?
Do not automatically assume:
profitable small campaign × 10 traffic = 10× profit.
Test the scale too.
Landing Page Improvements Can Increase ROI Without Cheaper Traffic
Suppose you buy the same traffic twice.
Both campaigns cost:
$200
Campaign A:
20% opt-in rate
60 leads
$120 revenue
ROI: −40%
Campaign B uses a stronger landing page:
35% opt-in rate
105 leads
$260 revenue
ROI: 30%
The provider did not get cheaper.
The funnel improved.
This is important because marketers sometimes spend all their effort looking for lower CPC while ignoring the part of the system they control.
Better Follow-Up Can Do the Same Thing
You could also leave the landing page unchanged.
Suppose both campaigns generate:
100 leads
Campaign A has a weak follow-up sequence:
Revenue: $150
Campaign B has a better sequence:
Revenue: $300
Same provider.
Same traffic.
Same CPL.
Very different ROI.
That is why the provider is only one piece of the outcome.
Where Did the Campaign Fail?
If ROI is poor, I would work backward through the funnel.
Were clicks too expensive?
Look at CPC.
Did visitors fail to subscribe?
Look at opt-in rate and landing page.
Were leads expensive?
Look at CPL.
Did leads disappear afterward?
Look at follow-up engagement.
Did engaged leads fail to convert?
Look at the offer and conversion process.
Did sales occur but revenue remain too low?
Look at offer value, commissions or customer value.
ROI tells you that there is a problem.
The earlier metrics help tell you where the problem may be.
A Full Solo Ad Campaign Example
Let’s put everything together.
Campaign
Cost: $240
Clicks: 400
Leads: 120
CPC:
$240 ÷ 400 = $0.60
Opt-in rate:
120 ÷ 400 × 100 = 30%
CPL:
$240 ÷ 120 = $2
After seven days:
32 follow-up clickers
4 sales
Revenue: $160
Current ROI:
($160 − $240) ÷ $240 × 100
= −33.3%
After 30 days:
8 total sales
Revenue: $320
Updated ROI:
($320 − $240) ÷ $240 × 100
= 33.3%
Now we can describe this campaign much more intelligently than:
“I bought 400 clicks.”
We know:
CPC: $0.60
Opt-in rate: 30%
CPL: $2
Follow-up clickers: 32
30-day revenue: $320
30-day ROI: 33.3%
That gives us something useful to compare against the next campaign.
A Simple ROI Record to Keep
For every test, I would save:
Provider
Campaign date
Campaign cost
Clicks
Opt-ins
CPL
Follow-up engagement
Conversions
Revenue at Day 7
Revenue at Day 30
ROI
Notes
After enough tests, you stop guessing which provider seems better.
You have your own campaign history.
And eventually, that history becomes much more valuable than generic claims about what a “good” solo ad campaign should look like.
The Formula Is Simple, but the Timeline Matters
The basic calculation never changes:
ROI = (Revenue − Cost) ÷ Cost × 100
Spend $200 and generate $300:
50% ROI
Spend $200 and generate $150:
−25% ROI
The part I would pay more attention to is everything behind that final number.
Where did the revenue come from?
How long did it take?
What did each lead cost?
Did those leads engage?
Could the campaign be repeated?
Did the ROI hold up when you increased the order?
Those questions tell you whether you found something worth scaling or just got a nice-looking result once.
For solo ads, I would think about campaign performance as one connected chain:
Clicks > Opt-ins > CPL > Engagement > Conversions > Revenue > ROI
Once you track that chain consistently, comparing providers becomes much easier.