

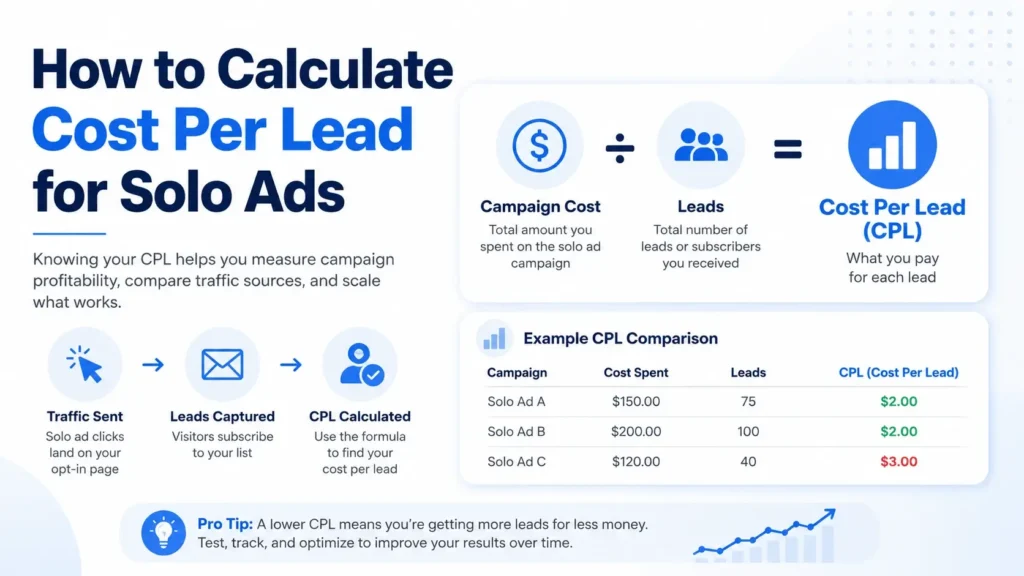
Cost per lead, usually shortened to CPL, tells you how much you paid for each new subscriber generated by a solo ad campaign.
The calculation is simple:
Cost per lead = Campaign cost ÷ Number of leads
If you spend $150 and collect 75 subscribers:
$150 ÷ 75 = $2 per lead
That $2 figure is far more useful than looking only at what you paid per click.
A provider can have expensive clicks and still produce cheaper leads if their traffic converts well. The opposite can happen with cheap traffic.
But CPL has one important limitation: it tells you what a lead cost, not whether that lead was any good.
That distinction becomes important once you start comparing providers.
Want to check your own campaign? Use our CPL Calculator for Solo Ads to enter your campaign cost and leads and see your cost per lead instantly.
Quick Answer
Solo ad cost per lead is simply your total traffic cost divided by the number of leads you collected.
If you spend $200 and get 100 leads, your CPL is $2. The useful part is comparing that number with lead quality and later results, not just trying to get the lowest CPL possible.
- A Simple Solo Ad CPL Example
- Why CPC and CPL Can Tell Different Stories
- Your Opt-In Rate Has a Huge Effect on CPL
- What Is a Good Cost Per Lead?
- Don't Confuse Cost Per Click With Cost Per Lead
- Which Campaign Cost Should You Use?
- Should You Count Every Opt-In as a Lead?
- A Cheap CPL Can Still Hide Weak Traffic
- Don't Chase the Lowest CPL at Any Cost
- Compare Providers With the Same Formula
- CPL Will Move From One Test to the Next
- Geography Can Change CPL Too
- Use Your Own Subscriber Data for CPL
- A Simple CPL Tracking Record
- How to Reduce Solo Ad CPL
- Don't Optimize CPL in Isolation
- When I Would Scale — and When I Would Stop
- A Better CPL Comparison
- The Formula Is Easy. Interpreting It Is the Useful Part.
- Frequently Asked Questions
A Simple Solo Ad CPL Example
Suppose you buy 250 clicks for $175 and collect 70 new subscribers. Your cost per lead is simply $175 ÷ 70 = $2.50.
250 clicks → $175 cost → 70 leads → $2.50 CPL
That number becomes useful when you compare one campaign with another. If another provider costs $200 but produces 100 leads, the CPL is $2. The second campaign costs more upfront, but each subscriber is cheaper to acquire.
Why CPC and CPL Can Tell Different Stories
Solo ads are usually sold by the click, so the advertised CPC gets a lot of attention. But a cheaper click does not automatically produce a cheaper lead. What matters is how many of those visitors actually subscribe.
Campaign A: $0.40 CPC, 300 clicks, 30 leads → $4 CPL
Campaign B: $0.70 CPC, 300 clicks, 105 leads → $2 CPL
Campaign B charges 75% more per click, yet each subscriber costs half as much. That is why I would not judge a solo ad order from click price alone. The same point applies in How Much Do Solo Ads Cost?.
Your Opt-In Rate Has a Huge Effect on CPL
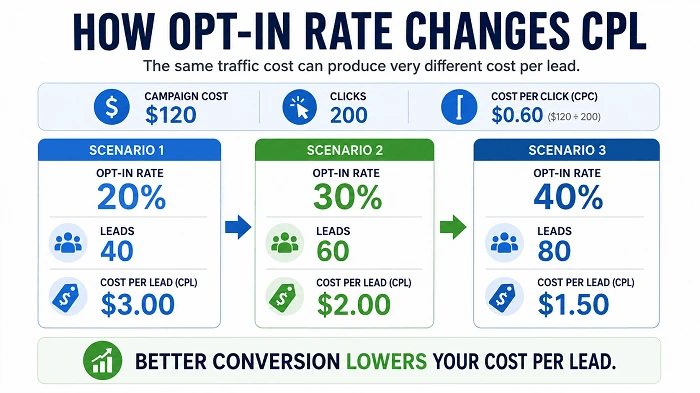
CPL and landing-page conversion rate are closely connected. If 200 clicks cost $120, the same traffic can produce very different lead costs depending on how well the page converts.
20% opt-in rate: 40 leads → $3 CPL
30% opt-in rate: 60 leads → $2 CPL
40% opt-in rate: 80 leads → $1.50 CPL
The traffic price never changed. Only the percentage of visitors who subscribed changed. That is why improving the landing page can sometimes reduce CPL more effectively than finding cheaper clicks.
The same idea shows up if you buy the same $180 traffic package twice. A page that produces 45 leads gives you a $4 CPL, while a better-matched page that produces 90 leads cuts that to $2. If CPL looks weak, I would check both traffic quality and landing-page performance before blaming the provider.
For more on that relationship, see What Is a Good Solo Ad Opt-In Rate?.
What Is a Good Cost Per Lead?
There is no universal solo ad CPL that I would call good. A $1 lead can be excellent in one funnel and almost worthless in another, while a $5 lead can still make sense if those subscribers are worth considerably more over time.
The better question is: how much can I afford to pay for a lead?
If the average subscriber eventually produces $3 in revenue, paying $1.50 may leave room for profit while paying $5 probably does not. If another funnel earns $20 from the average lead, that same $5 CPL could be perfectly reasonable. That is why blanket claims such as “a good solo ad lead should cost under $2” are not very useful without the economics behind them.
Compare CPL With Lead Value
Once you have enough history, I would compare what a lead costs with what a lead is actually worth. A $2 CPL against an average lead value of $3.50 leaves some room. A $4 CPL against a $1.75 lead value is much harder to justify unless another part of the funnel improves.
You may not know your lead value when you are starting out, and that is fine. Early campaigns help build the data. Over time, your own lead value becomes much more useful than somebody else’s CPL benchmark.
Don’t Confuse Cost Per Click With Cost Per Lead
CPC and CPL measure different stages of the funnel. CPC tells you what each visitor cost. CPL tells you what each new subscriber cost.
$150 campaign
300 clicks → $0.50 CPC
75 leads → $2 CPL
The click cost is only the traffic price. The lead cost includes what happened after those visitors reached the page.
Which Campaign Cost Should You Use?
For a simple provider comparison, I would usually calculate CPL from the direct traffic spend. If a $200 solo ad purchase generates 80 leads, the traffic CPL is $2.50.
For a wider profitability view, you may also want a fully loaded number that includes campaign-specific software or other costs. Add $30 of tracking and landing-page costs to the same campaign and the total becomes $230, giving you a fully loaded CPL of about $2.88.
Traffic CPL: $2.50
Fully loaded CPL: $2.88
Both numbers can be useful. The important part is labeling them clearly and using the same method when you compare providers. If Provider A is measured using traffic cost only and Provider B includes software and fees, the comparison is no longer fair.
Should You Count Every Opt-In as a Lead?
For a basic CPL calculation, yes. If 100 people submit the form, those 100 signups are the denominator. But that does not mean all 100 subscribers are equally valuable after they join your list.
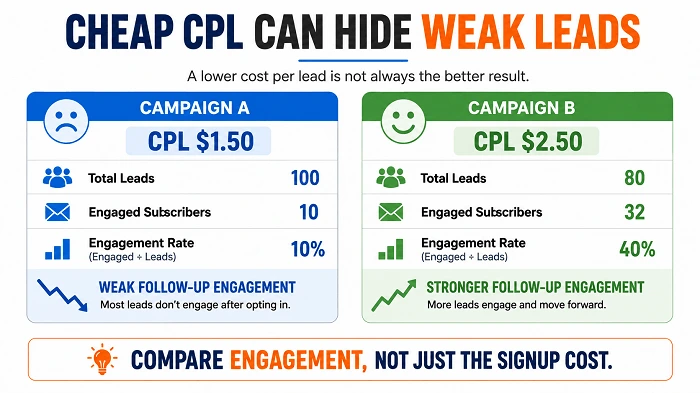
For example, a $200 campaign that produces 100 signups has a basic CPL of $2. If only ten of those subscribers click another email during the next week, the campaign also cost $20 for every subscriber who showed that deeper level of engagement.
I would not replace CPL with an “engaged lead cost,” because CPL still tells you how efficiently you acquired subscribers. I would use the engagement number beside it to see whether those cheap signups turned into useful leads.
A Cheap CPL Can Still Hide Weak Traffic
This is where CPL can become misleading if you look at it in isolation. One campaign might produce 200 subscribers at a $1 CPL but almost no follow-up clicks and no conversions. Another might cost $2 per lead, produce fewer subscribers, and still create far more engagement and sales.
Campaign A: $1 CPL, 200 subscribers, 4 follow-up clickers, no meaningful conversions
Campaign B: $2 CPL, 120 subscribers, 38 follow-up clickers, several conversions
The first campaign wins on CPL. The second may still be the one I would rather scale. That is why How to Track Solo Ads matters: the value of a lead starts after the opt-in, not at the form submission.
Don’t Chase the Lowest CPL at Any Cost
Optimizing only for the lowest possible CPL can create the wrong incentives. You can often increase signups by using broader traffic, weaker qualification or an offer that almost anyone will claim, but that does not automatically create better subscribers.
Sometimes a landing page that filters people a little more carefully produces fewer leads but a healthier list. I would rather pay a sustainable price for useful subscribers than celebrate a very low CPL attached to people who disappear immediately afterward.
The goal is not the lowest CPL possible. It is useful leads at a cost your funnel can support.
Compare Providers With the Same Formula
Suppose you test three providers.
| Provider | Campaign Cost | Leads | CPL |
|---|---|---|---|
| A | $120 | 40 | $3.00 |
| B | $180 | 90 | $2.00 |
| C | $250 | 100 | $2.50 |
Provider B has the lowest CPL, which is useful, but it does not finish the comparison. Once you add later-stage engagement, the picture changes:
| Provider | CPL | Follow-up clickers |
|---|---|---|
| A | $3.00 | 15 |
| B | $2.00 | 18 |
| C | $2.50 | 34 |
Provider C now becomes more interesting despite not having the lowest CPL. That is exactly why I use CPL to narrow the comparison, then look at what those subscribers do next.
CPL Will Move From One Test to the Next
One campaign might come in at $1.90 per lead, the next at $2.40, and the third at $2.10. That does not automatically mean something went wrong. Different subscribers see the email, traffic arrives at different times, and the provider’s audience can change slightly from one order to another.
That is why I would keep each order separate before calculating a longer-term average. Three tests clustered around $2–$2.30 tell a very different story from three tests at $1.50, $4.80 and $6.20. Consistency has value too.
Order Size Can Change the Result
A small test can look excellent and still behave differently when you scale it. If the first 100 clicks produce 45 leads, that does not guarantee the next 1,000 clicks will produce exactly 450. Larger orders may reach a broader part of the list, so I would scale gradually and see whether the CPL holds up.
That is the same reason we recommend staged testing in How Many Solo Ad Clicks Should You Buy?.
Geography Can Change CPL Too
More expensive traffic can still produce cheaper leads if it converts better. For example, Tier 1 traffic might cost $240 and produce 120 leads for a $2 CPL, while a broader $150 campaign produces only 50 leads for a $3 CPL.
Tier 1: $240 cost → 120 leads → $2 CPL
Broader traffic: $150 cost → 50 leads → $3 CPL
The more expensive traffic wins on lead cost in that example. Geography is only one variable, but it is another reason not to judge a campaign from CPC alone. See What Is Tier 1 Solo Ad Traffic? for the targeting side.
Use Your Own Subscriber Data for CPL
The provider can tell you how many clicks were delivered. Your own landing-page or email system tells you how many people actually joined your list, so that is the number I would use for CPL.
If a $190 campaign delivers 300 clicks and your system records 95 new subscribers, your CPL is $2. That is your campaign result, regardless of how the seller presents the traffic.
Watch Duplicates and Invalid Emails
Raw form submissions can slightly overstate how many new leads you actually acquired. If 100 people submit the form but 12 were already on your list, a $176 campaign added 88 genuinely new subscribers. The raw CPL is $1.76, while the new-subscriber CPL is $2.
The same idea applies to unusable addresses. If a $180 campaign produces 100 opt-ins but ten are obviously invalid, the basic CPL is $1.80 while the cost per usable lead is $2. There is nothing wrong with keeping the basic number; just be clear about what it measures.
A Simple CPL Tracking Record
For each test, I would keep the provider, date, campaign cost, clicks, new leads, opt-in rate, CPL, follow-up engagement and conversions together. That gives you something useful to compare months later instead of relying on memory.
Example record
Provider A · $180 cost · 300 clicks · 90 new leads · 30% opt-in rate · $2 CPL · 24 follow-up clickers · 3 conversions
How to Reduce Solo Ad CPL
There are two basic levers: pay less for the traffic or convert more of the traffic you already buy. Cheaper clicks help only if the quality stays similar, so I am usually more interested in improving the conversion path.
- better traffic-to-offer match
- a clearer headline and lead magnet
- faster mobile pages
- a simpler form
- stronger message match between the provider email and landing page
Those changes can produce more subscribers from the same number of clicks without forcing you to hunt for the cheapest traffic.
Don’t Optimize CPL in Isolation
If a landing-page change drops CPL from $2.50 to $1.40, that looks great. But if follow-up engagement collapses at the same time, you may simply have attracted more people without attracting the right people.
After a major CPL improvement, I would still check whether the leads open, click, stay subscribed and eventually convert. Sometimes improving one number makes another one worse, so the funnel has to be judged as a whole.
When I Would Scale — and When I Would Stop
I would scale a low-CPL campaign only after the rest of the picture looks healthy too: delivery is normal, geography matches, follow-up engagement is useful, tracking works and there are at least some signs of conversion.
I would stop even with an impressive CPL if the leads rarely open, almost nobody clicks, unsubscribes are unusually high or conversions remain near zero. At that point you are paying for cheap email addresses, not necessarily valuable subscribers.
A Better CPL Comparison
Eventually I want more than a single CPL number. If Provider A produces a $1.80 CPL but only 8% of those leads engage and one converts, while Provider B costs $2.40 per lead but 28% engage and five convert, Provider B may be the stronger source despite the higher CPL.
Provider A: $1.80 CPL · 8% engaged · 1 conversion
Provider B: $2.40 CPL · 28% engaged · 5 conversions
The Formula Is Easy. Interpreting It Is the Useful Part.
The calculation itself takes a few seconds: campaign cost ÷ new leads = CPL. If you spend $240 and generate 120 new leads, your CPL is $2.
The useful work comes afterward: deciding whether $2 is good for your funnel, whether those subscribers engage, whether the result holds up when you buy more traffic, and how it compares with another provider.
Cost per click → Opt-in rate → Cost per lead → Follow-up engagement → Conversions → Revenue
If you run several campaigns, the Free Solo Ad Tracker can keep those results together. The next step is connecting the full funnel back to profit in How to Calculate Solo Ad ROI.