

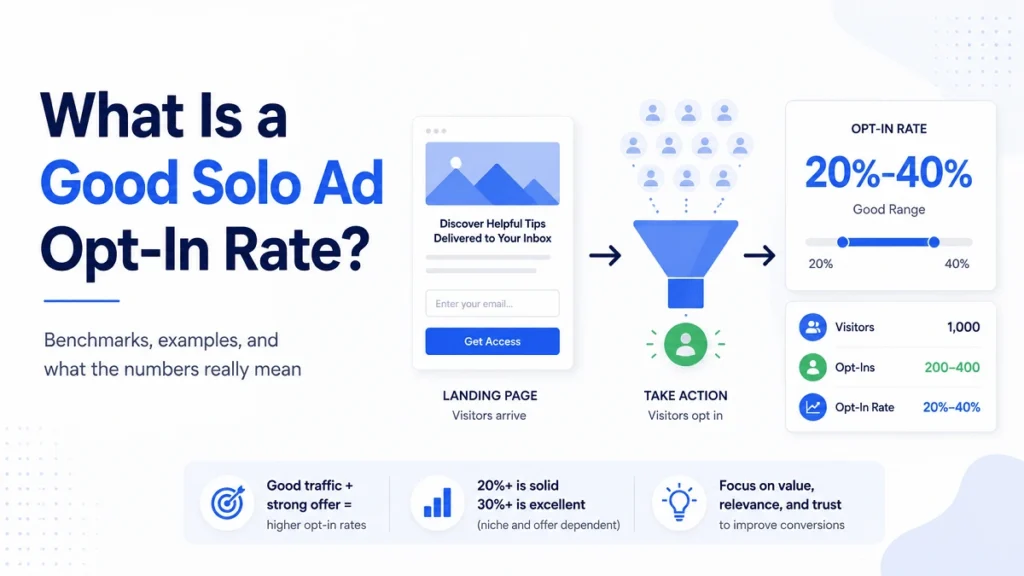
There is no single opt-in rate that every solo ad campaign should hit. For a simple landing page offering something relevant in exchange for an email address, I would generally treat 20–40% as a useful working range.
That is only a starting point. A 45% opt-in rate can still produce weak leads, while a 25% rate can sometimes build a much more engaged email list.
Quick Answer
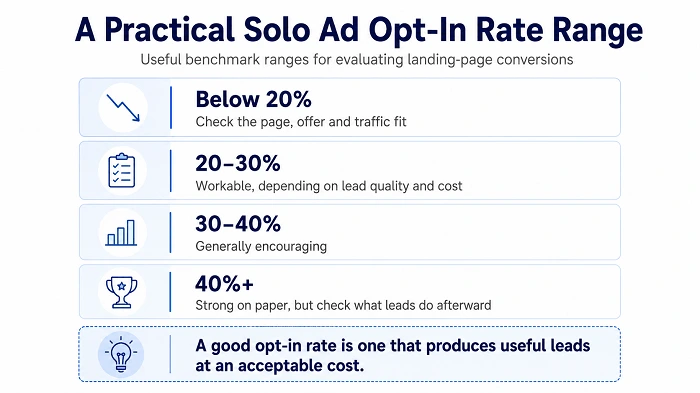
Below 20%: worth checking the page, offer and traffic fit
20–30%: workable, depending on lead quality and cost
30–40%: generally encouraging
40%+: strong on paper, but check what the leads do afterward
These are rough evaluation ranges, not guaranteed standards.
The most useful opt-in rate is one that produces leads at an acceptable cost and those leads continue to engage after subscribing.
- What Is an Opt-In Rate?
- Why Opt-In Rate Matters With Solo Ads
- But a Higher Opt-In Rate Is Not Automatically Better
- What Would I Consider a Weak Opt-In Rate?
- How I Read Different Opt-In Rate Ranges
- Why Two Providers Can Produce Very Different Opt-In Rates
- The Provider's Email Can Affect Your Opt-In Rate Too
- Your Offer Matters More Than Small Design Changes
- Keep the Page Focused
- Mobile Experience and Page Speed Matter
- Clicks and Visitors May Not Be the Same Number
- Don't Change the Page Halfway Through a Provider Test
- How Many Clicks Do You Need Before Trusting the Rate?
- Opt-In Rate and Cost per Lead Work Together
- What If My Opt-In Rate Is Low?
- What If the Opt-In Rate Is Very High?
- Measure the Funnel in Stages
- A Simple Campaign Example
- So What Is a Good Solo Ad Opt-In Rate?
- Frequently Asked Questions
What Is an Opt-In Rate?
Your opt-in rate tells you what percentage of visitors became subscribers. The formula is simple:
Opt-in rate = Leads ÷ Visitors × 100
200 visitors and 70 new subscribers = 35% opt-in rate
In other words, about 35 out of every 100 visitors submitted their email address.
Why Opt-In Rate Matters With Solo Ads
Solo ads are normally bought by the click, so every visitor has a cost. If two campaigns receive the same number of clicks but one converts more visitors into subscribers, the economics can look very different.
| Campaign | Clicks | Leads | Opt-in rate | CPL on $140 spend |
|---|---|---|---|---|
| A | 200 | 30 | 15% | $4.67 |
| B | 200 | 80 | 40% | $1.75 |
The traffic cost is identical, but Campaign B turns more of that traffic into leads and cuts the CPL sharply. That is why opt-in rate matters so much with paid traffic.
But a Higher Opt-In Rate Is Not Automatically Better
This is probably the most important part of the article.
Here’s a simple example. One campaign can produce more opt-ins, while another produces fewer opt-ins but much better follow-up engagement.
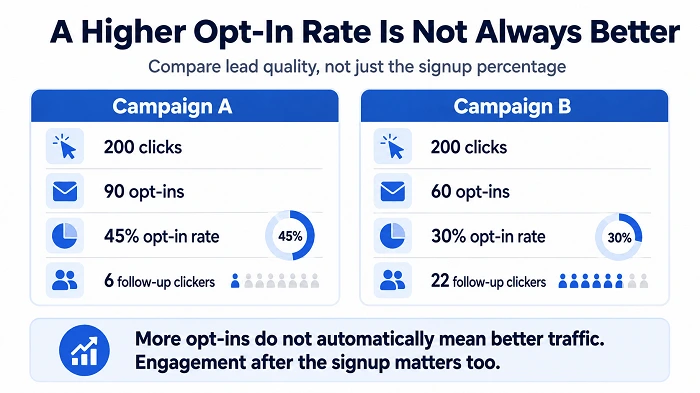
If you only look at opt-ins, Campaign A wins easily. But Campaign B appears to have produced the more engaged audience, which is why I would not judge a solo ad provider entirely by landing-page conversion.
The opt-in is only the beginning; what those subscribers do afterward is what tells you whether the traffic was genuinely useful.
A strong opt-in rate is useful, but the cost of each lead matters too. Use the CPL Calculator for Solo Ads to check your actual lead cost.
What Would I Consider a Weak Opt-In Rate?
If a simple squeeze page is converting below roughly 20%, I would want to investigate why, but I would not automatically blame the traffic. A weak result can come from the page, the offer or the traffic-to-offer match.
Possible problems include:
- weak headline
- unclear offer
- poor traffic-to-offer match
- slow loading page
- too many distractions
- form problems
- poor mobile experience
- weak lead magnet
- confusing copy
Before blaming the provider, check the page itself. A weak landing page can make perfectly usable traffic look much worse than it really is.
How I Read Different Opt-In Rate Ranges
20–30%: Workable, Depending on Lead Quality
I would not automatically call a 20–30% opt-in rate poor. If 300 clicks produce 81 subscribers, that is a 27% opt-in rate. If those subscribers open emails, click links and eventually convert, the campaign can still be perfectly useful.
30–40%: Generally Encouraging
For a focused lead-generation page, I would usually be encouraged by a result in this range. For example, 90 subscribers from 250 clicks is a 36% opt-in rate. On a $150 campaign, that would also mean a CPL of about $1.67.
At that point I would stop obsessing over the landing-page number and start checking what those leads do next: opens, follow-up clicks, unsubscribes and conversions.
40%+: Strong on Paper, but Keep Measuring
A 40%+ opt-in rate can be excellent. There is nothing inherently suspicious about 135 leads from 300 clicks, or a 45% opt-in rate, when the offer and audience are well matched.
A high opt-in rate is a positive signal, not proof of high-quality traffic.
I would still check whether those subscribers open, click, stay subscribed and eventually convert. A slightly lower opt-in rate with stronger follow-up behavior can be more valuable than a very high rate filled with people who disappear immediately.
Why Two Providers Can Produce Very Different Opt-In Rates
Suppose you send exactly the same landing page to two providers:
| Provider | Clicks | Leads | Opt-in rate |
|---|---|---|---|
| A | 300 | 72 | 24% |
| B | 300 | 123 | 41% |
Provider B’s audience may simply be a better fit, but several other factors can produce the difference:
- different countries
- different list demographics
- different email copy used to send the traffic
- different levels of audience fatigue
- different devices
- different traffic timing
That is why comparing providers works best when you keep your own funnel as consistent as possible.
The Provider’s Email Can Affect Your Opt-In Rate Too
The landing page is not the first thing the visitor sees; the provider’s email sets the expectation before the click. If the message promises a free email-marketing guide and the landing page offers exactly that, the transition feels natural. If the email makes the offer sound like something completely different, the visitor can arrive confused and leave.
That message-to-page match can affect the conversion rate, which is another reason I would not treat opt-in rate as a pure measurement of traffic quality.
Your Offer Matters More Than Small Design Changes
It is easy to obsess over small design choices such as a green button versus a blue one when the bigger issue is the offer itself. A generic “Join my newsletter” gives a stranger very little reason to subscribe, while something specific such as “Get the 7-point solo ad provider checklist” makes the value clear immediately.
A stronger reason to subscribe can improve the conversion rate far more than tiny cosmetic changes.
Keep the Page Focused
Paid traffic generally works better when the visitor reaches one clear destination. A simple solo ad landing page might contain:
- one headline
- short explanation
- one clear benefit
- email form
- one call to action
If the page also contains:
- navigation menu
- ten blog links
- social profiles
- multiple offers
- advertisements
- unrelated buttons
the visitor has many opportunities to leave without subscribing.
That does not mean every landing page has to be extremely minimal.
But the page should make the intended next step obvious.
Mobile Experience and Page Speed Matter
A lot of email traffic arrives on phones, so I would always check the landing page on a real mobile device. Tiny text, awkward forms, intrusive popups or buttons that are difficult to tap can hurt conversions even when the desktop version looks fine.
Speed matters for the same reason. If someone clicks from an email and waits several seconds for the page to appear, some visitors will leave before the offer gets a chance to work. When an otherwise sensible campaign converts unusually poorly, mobile usability and loading time are two of the first things I would check.
Clicks and Visitors May Not Be the Same Number
A provider may report 250 delivered clicks while your analytics shows 232 unique visitors. That difference can come from repeat clicks, tracking rules, filtered traffic, browser privacy settings or people leaving before your analytics fully loads.
75 leads ÷ 250 provider clicks = 30%
75 leads ÷ 232 tracked visitors = 32.3%
Neither result is automatically wrong; they simply use different denominators. For your own campaign comparisons, pick one tracking method and use it consistently.
Don’t Change the Page Halfway Through a Provider Test
Suppose:
First 100 clicks → version A
Next 100 clicks → version B
and the campaign finishes with a 34% conversion rate.
What did you actually test?
It becomes difficult to tell.
If the purpose is evaluating a provider, I would keep the landing page stable during the campaign where practical.
Then test another page separately.
Changing too many variables at once makes the results harder to interpret.
How Many Clicks Do You Need Before Trusting the Rate?
Small samples can make an opt-in rate look more stable than it really is. A 50% rate after ten visitors means only five leads; the same 50% rate after 500 visitors means 250 leads and gives you a much stronger signal.
With 10 visitors, one extra lead changes the rate by 10 percentage points. With 500 visitors, one extra lead changes it by only 0.2 points.
That is one reason I prefer starting with roughly 100–300 clicks for a new-provider test, as discussed in How Many Solo Ad Clicks Should You Buy?.
Opt-In Rate and Cost per Lead Work Together
If you spend $120 on 200 clicks, a stronger opt-in rate can change your CPL dramatically even though the traffic price stays exactly the same.
| Opt-in rate | Leads | CPL |
|---|---|---|
| 20% | 40 | $3.00 |
| 30% | 60 | $2.00 |
| 40% | 80 | $1.50 |
| 50% | 100 | $1.20 |
This is why improving the page can sometimes be more valuable than hunting for cheaper clicks. The reverse is also true: a low CPC can still produce an expensive lead if the traffic converts poorly.
For example, Provider A might charge $0.40 per click but convert at 15%, producing a $2.67 CPL. Provider B might charge $0.70 per click but convert at 40%, producing a lower $1.75 CPL. The advertised click price does not tell the whole story.
What If My Opt-In Rate Is Low?
I would troubleshoot before buying more traffic. First make sure the form works, the page loads quickly on mobile, the headline is clear, the offer matches the traffic and there is one obvious action for the visitor to take.
I would also compare your tracking with the provider’s delivery numbers. If visitors are reaching the page normally but the opt-in rate is still weak, test the offer or landing page before deciding the traffic itself is the problem.
What If the Opt-In Rate Is Very High?
I would not scale automatically just because a campaign shows 50% or 60%. A very high rate is worth celebrating only if the subscribers do something useful afterward.
| Campaign A | Campaign B | |
|---|---|---|
| Visitors | 200 | 200 |
| Leads | 120 | 75 |
| Opt-in rate | 60% | 37.5% |
| Follow-up clickers | 4 | 25 |
| Conversions | 0 | 3 |
Campaign A wins the landing-page contest, but Campaign B looks more useful once you follow the subscribers beyond the opt-in.
Measure the Funnel in Stages
I would think about the campaign as one chain rather than one percentage:
Traffic → Opt-in → Follow-up engagement → Conversion
At each stage, ask a different question: did useful visitors arrive, did they subscribe, did they keep engaging, and did any of them eventually take the action you wanted? The Free Solo Ad Tracker can help keep those numbers together across campaigns.
A Simple Campaign Example
Suppose a campaign costs $180 and sends 300 clicks. It produces 105 leads, so the opt-in rate is 35% and the CPL is about $1.71.
Campaign snapshot
300 clicks → 105 leads → 35% opt-in rate
CPL: $1.71
7-day follow-up clickers: 29
30-day conversions: 5
That tells me far more than saying, “My opt-in rate was 35%.” Now I can judge what the leads cost and whether they continued to show interest after joining the list.
So What Is a Good Solo Ad Opt-In Rate?
I would use 20–40% as a rough practical evaluation range, not as an official benchmark. Below 20%, I would usually investigate the page, offer and traffic fit. Between 20% and 40%, the campaign may be perfectly workable depending on CPL and lead quality. Above 40%, the landing-page result looks encouraging, but I would still verify that the subscribers engage afterward.
The best opt-in rate is not necessarily the highest one. It is the rate that helps you acquire useful subscribers at a cost your funnel can support.
Next guide: How to Track Solo Ads